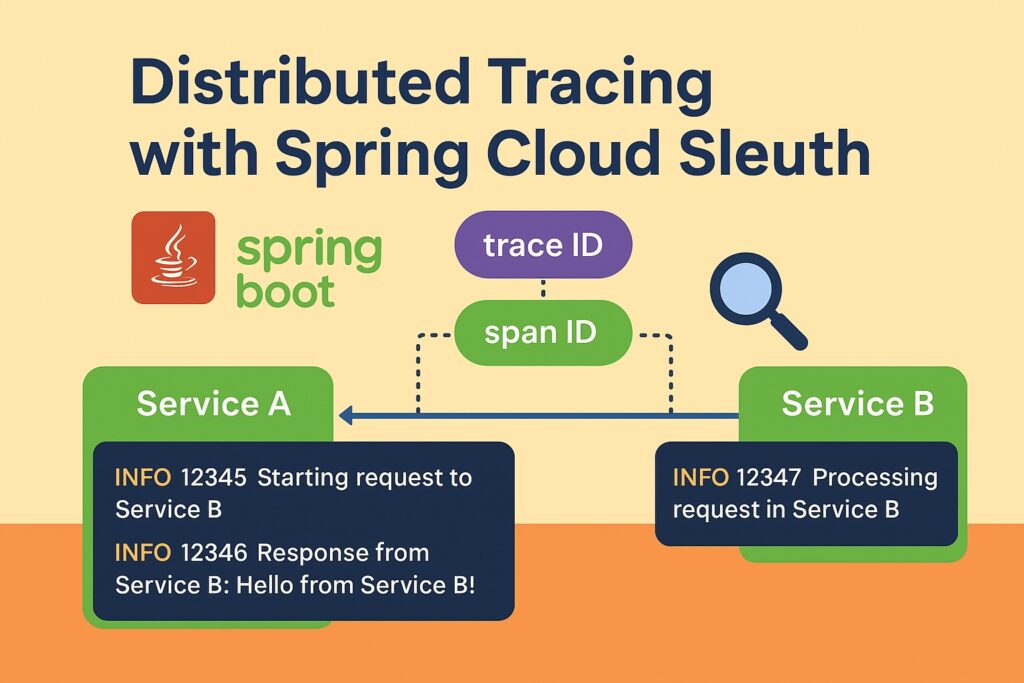
Modern microservice architectures often involve multiple services communicating with each other through HTTP, messaging systems, or event streams. Debugging issues across these distributed systems can be challenging—logs from different services often don’t have a common identifier.
This is where Spring Cloud Sleuth comes in. It provides distributed tracing by automatically generating and propagating trace IDs and span IDs across services, making it much easier to follow a request’s journey through multiple systems.
What is Spring Cloud Sleuth?
Spring Cloud Sleuth integrates with logging frameworks (like Logback or Log4j2) and automatically attaches tracing information (trace IDs and span IDs) to log entries.
- Trace ID: A unique ID that represents the entire request across all services.
- Span ID: A unique ID that represents a single operation or step within the trace.
- Parent Span ID: Refers to the span that triggered the current operation.
When combined with a visualization tool like Zipkin or Jaeger, you get a powerful distributed tracing setup.
Project Setup
We’ll build a simple two-service example:
- Service A → calls Service B using
RestTemplate. - Both services use Spring Cloud Sleuth.
Dependencies (Maven)
Add these to both pom.xml files:
<dependencies>
    <!-- Spring Boot Starter Web -->
    <dependency>
        <groupId>org.springframework.boot</groupId>
        <artifactId>spring-boot-starter-web</artifactId>
    </dependency>

    <!-- Spring Cloud Sleuth -->
    <dependency>
        <groupId>org.springframework.cloud</groupId>
        <artifactId>spring-cloud-starter-sleuth</artifactId>
    </dependency>

    <!-- Optional: Zipkin integration -->
    <dependency>
        <groupId>org.springframework.cloud</groupId>
        <artifactId>spring-cloud-starter-zipkin</artifactId>
    </dependency>

    <!-- Lombok (optional, for cleaner code) -->
    <dependency>
        <groupId>org.projectlombok</groupId>
        <artifactId>lombok</artifactId>
        <optional>true</optional>
    </dependency>
</dependencies>Also include Spring Cloud dependencies in your pom.xml:
<dependencyManagement>
    <dependencies>
        <dependency>
            <groupId>org.springframework.cloud</groupId>
            <artifactId>spring-cloud-dependencies</artifactId>
            <version>2023.0.3</version>
            <type>pom</type>
            <scope>import</scope>
        </dependency>
    </dependencies>
</dependencyManagement>Service B (Downstream Service)
// ServiceBApplication.java
package com.example.serviceb;

import org.springframework.boot.SpringApplication;
import org.springframework.boot.autoconfigure.SpringBootApplication;
import org.springframework.web.bind.annotation.GetMapping;
import org.springframework.web.bind.annotation.RestController;

@SpringBootApplication
public class ServiceBApplication {
    public static void main(String[] args) {
        SpringApplication.run(ServiceBApplication.class, args);
    }
}

@RestController
class ServiceBController {

    @GetMapping("/process")
    public String process() {
        return "Hello from Service B!";
    }
}Run this on port 8081.
# application.yml
server:
  port: 8081
spring:
  application:
name: service-bService A (Upstream Service)
// ServiceAApplication.java
package com.example.servicea;

import lombok.RequiredArgsConstructor;
import org.springframework.boot.SpringApplication;
import org.springframework.boot.autoconfigure.SpringBootApplication;
import org.springframework.context.annotation.Bean;
import org.springframework.web.bind.annotation.GetMapping;
import org.springframework.web.bind.annotation.RestController;
import org.springframework.web.client.RestTemplate;

@SpringBootApplication
public class ServiceAApplication {
    public static void main(String[] args) {
        SpringApplication.run(ServiceAApplication.class, args);
    }

    // RestTemplate bean so Sleuth can instrument it
    @Bean
    public RestTemplate restTemplate() {
        return new RestTemplate();
    }
}

@RestController
@RequiredArgsConstructor
class ServiceAController {

    private final RestTemplate restTemplate;

    @GetMapping("/start")
    public String start() {
        String response = restTemplate.getForObject("http://localhost:8081/process", String.class);
        return "Response from Service B: " + response;
    }
}Run this on port 8080.
# application.yml
server:
  port: 8080
spring:
  application:
name: service-aRunning the Example
- Start Service B (
8081) - Start Service A (
8080) - Access
http://localhost:8080/start
What You’ll See in Logs
When you hit the /start endpoint, both services log entries with trace IDs:
Logs from Service A
2025-09-13 10:12:34.123  INFO [service-a,4e5b9c0f9c2e7f1f,4e5b9c0f9c2e7f1f] ...
Starting request to Service BLogs from Service B
2025-09-13 10:12:34.456  INFO [service-b,4e5b9c0f9c2e7f1f,8c1e7d2b3f6a1e4d] ...
Processing request in Service BNotice:
- Both share the same Trace ID (
4e5b9c0f9c2e7f1f). - Span IDs differ (
4e5b9c0f9c2e7f1fvs.8c1e7d2b3f6a1e4d).
This means you can trace a single request across both services.
Optional: Zipkin Integration
You can add Zipkin by running:
docker run -d -p 9411:9411 openzipkin/zipkinThen configure in application.yml:
spring:
  zipkin:
    base-url: http://localhost:9411
  sleuth:
    sampler:
probability: 1.0 # always sampleAccess http://localhost:9411 to visualize traces.
Conclusion
With Spring Cloud Sleuth, distributed tracing becomes straightforward:
- Every request automatically gets trace/span IDs.
- These IDs propagate across service boundaries.
- You can use Zipkin or Jaeger for visualization.
This setup significantly simplifies debugging and monitoring in microservice environments.


